


Correction, Crash Or Opportunity


Correction, Crash or Opportunity?
01. What happened?
Sensex is down 15% from the previous peak!
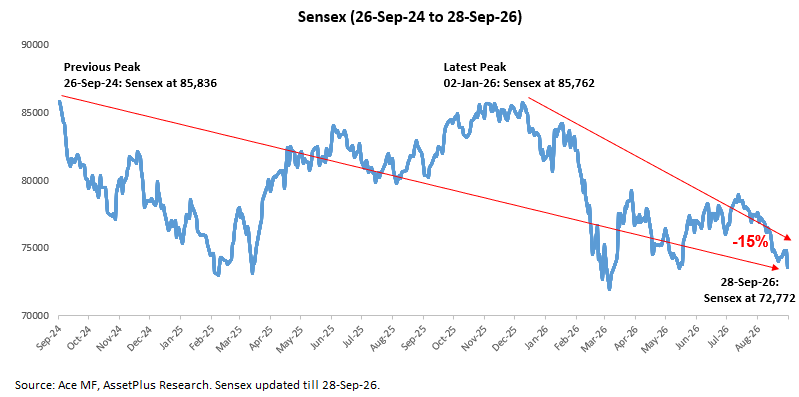
02. There is no shortage of explanations!
RATES | High US bond yields
US 10Y yields at 5.2% are at their highest since 2007, led by oil-led inflation fears, a hawkish Fed and persistent fiscal concerns.
GEOPOLITICS | US-Iran conflict
Escalating tensions between the US and Iran.
COMMODITIES | High crude oil prices
Brent crude surged to ~$107/barrel amid the US-Iran conflict. But explaining why markets are falling doesn’t answer the question you really care about.
Is this a normal 10-20% correction, or the beginning of a much larger, prolonged 40-60% fall?
03. First, some context
There is always bad news
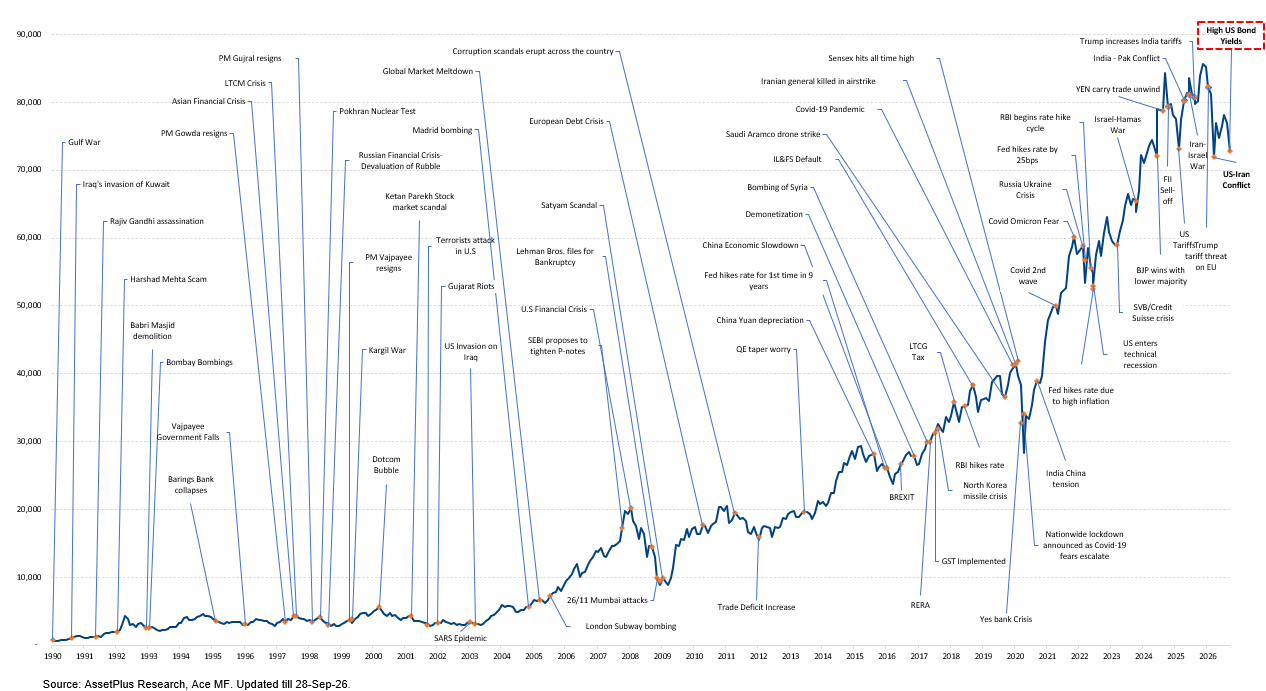
10-20% corrections are normal and happen almost EVERY YEAR
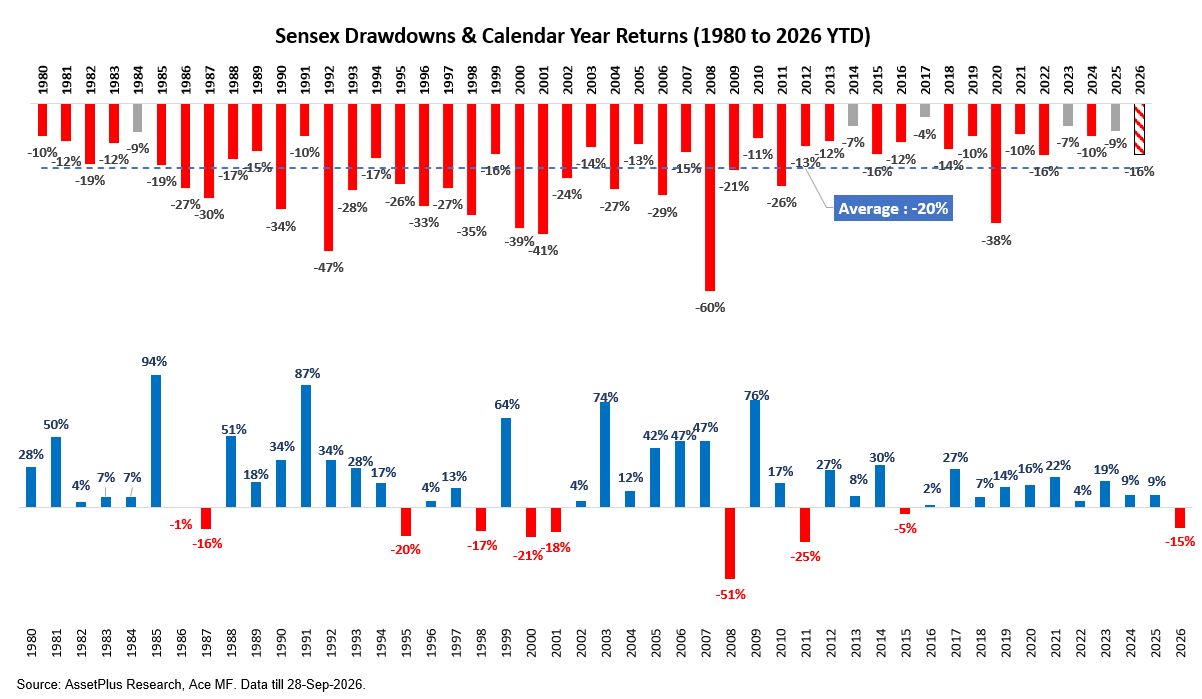
Every year had a temporary decline.
In fact, 41 out of 46 calendar years (all except 1984, 2014, 2017 and 2023) saw an intra-year decline of more than 10%.
However, 3 out of 4 years still ended with positive returns, inspite of intra-year declines of 10-20% almost every year, showing that most of these declines were usually short-lived, with recoveries happening within the same year.
Viewed in this context, the current fall of ~15% is perfectly normal and is to be expected almost every year.
So a market decline of 10-15% does not automatically mean a large market crash.
But sometimes it is different, and markets do fall 40-60%
Every 7-10 years or so, markets have experienced much deeper and more prolonged declines.
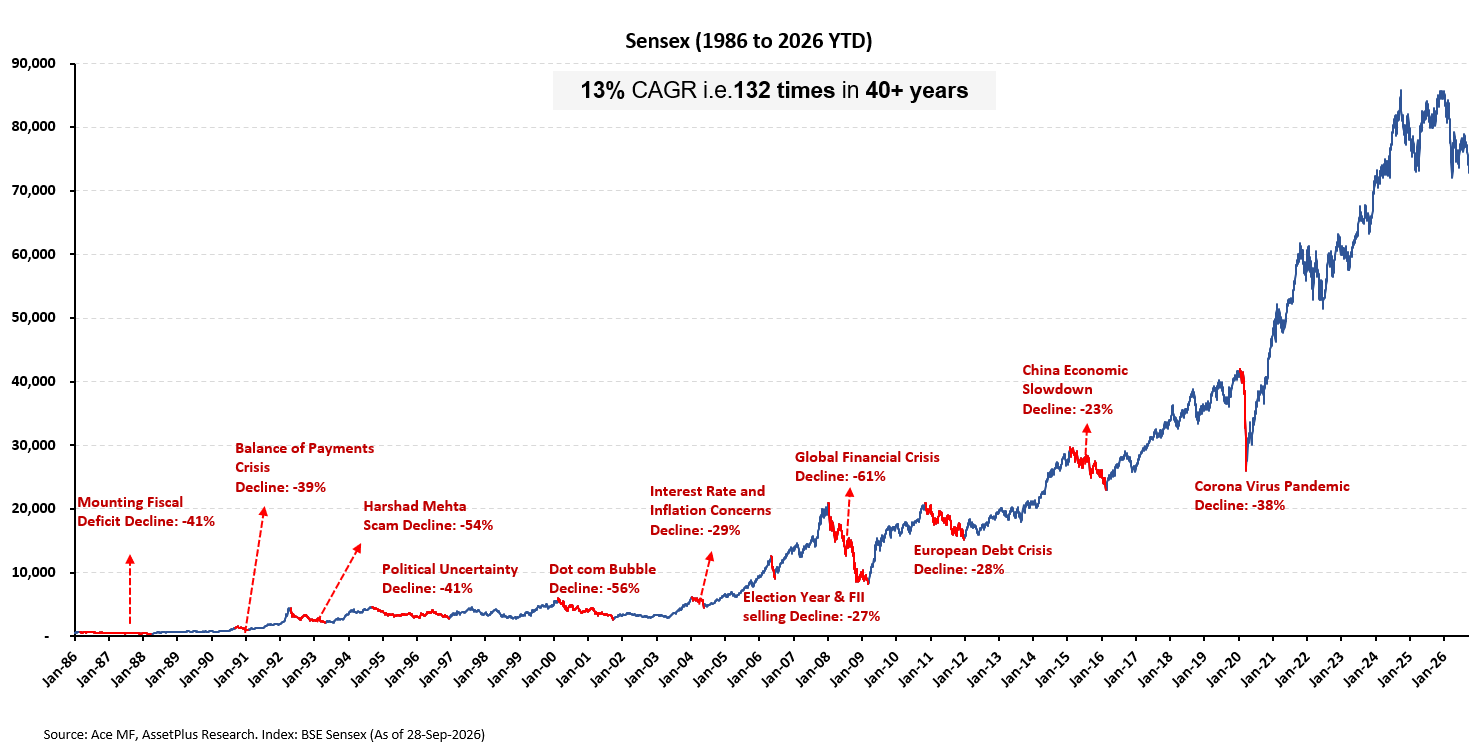
But as the chart above shows, even these sharp declines have historically been temporary. Indian equity markets have eventually recovered and gone on to make new highs, supported by the underlying growth in corporate earnings.
04. So, which one is this?
Since every large decline must start as a small one, is the current 15% fall a temporary correction or the beginning of a large market crash?
If it is a normal correction, falling prices can create an opportunity.
If it is the beginning of a major market crash, buying now to capitalize on the 15% fall could potentially turn out to be premature.
So how do we distinguish between the two?
05. Think in three market phases
The equity market broadly moves through three phases: Bull → Bubble → Bear.
A Bull market can withstand bad news. A Bubble is different.
When valuations, earnings cycle, flows and sentiment become extreme, along with weak macro, high leverage or political instability, even a relatively ordinary trigger (bad news) can turn a regular correction into a large, prolonged market decline..
This leads to an important insight:
Bad news doesn’t necessarily cause a crash.
Bad news hitting a market that is already in a bubble can eventually lead to a crash.
So, the real question isn’t just: “What is the bad news?”
It is: “What condition was the market in when the bad news arrived?”
In other words, when in a Bubble phase, the odds of a 10-20% correction turning into a large decline is very high.
06. How do you identify a market bubble?
We use our Five Blindmen Framework. Here is what a bubble typically looks like, and where we stand today:
Our assessment is that the current market decline did not begin from a bubble-like starting point.
The likelihood of the current fall turning into a large fall (40-60%) is very low, as we are in the middle of a multi-year bull upcycle with no signs of a bubble.
Historically, at every sharp fall where starting conditions did not indicate a bubble, recoveries have tended to be sharp and swift (for example, the 2020 recovery after the Covid crash).
07. So, what does this mean for you?
For us, the conclusion is not: “The market cannot fall further.”
It absolutely can.
The conclusion is: the current decline looks more like a correction within a bull market cycle than the bursting of a pre-existing bubble.
This is a phase to increase equity exposure, not reduce it.
08. What should you do?
09. What if markets fall further?
This is where having a pre-decided plan matters. Don’t decide what to do after the market falls. Decide before it falls.
Introducing the CRISIS plan
The exact levels can be adapted to your risk profile, but the principle is simple:
Don’t predict the bottom. Pre-decide how you will respond to falling markets.
10. Parting thoughts
Every past decline looks like an opportunity in hindsight. The current one always feels like a risk!
And that is the paradox of investing: the opportunity always looks frightening and confusing when it arrives.
Every major decline eventually becomes a chart. But when you're living through it, you don't know whether you're looking at the beginning of an opportunity or the beginning of something worse.
That is why the hardest part of investing isn't knowing what happened before.
It is deciding what to do when you don't know what happens next.
So perhaps the better question isn't: “Are you worried about the returns of the past?”
It is: “Given what you know today, what will you wish you had done when you look back five years from now?”
Happy Investing :)
This document is solely for educational purposes and meant for private circulation among AssetPlus Distributors. It does not constitute an offer, solicitation, or recommendation to buy, sell, or subscribe to any securities or financial products. The information contained herein is based on sources believed to be reliable and is provided in good faith; however, no representation or warranty, express or implied, is made as to its accuracy or completeness. AssetPlus does not accept any liability for any direct or indirect loss or damage arising from the use of this information or from any decision taken based on it. This document should not be construed as investment advice, legal advice, or tax advice. Past performance, if any, is not indicative of future results. Mutual Fund investments are subject to market risks, read all scheme-related documents carefully. Investments in Specialized Investment Funds involve relatively higher risk, including potential loss of capital, liquidity risk, and market volatility.
FOR INVESTOR/PARTNER USE · NOT INVESTMENT ADVICE
.jpg)